Daily Activity
Amongst all the data I have collected the one that I found most interesting and the one that catched my eye first wast my “ip logs” i.e. the date and the time I have loggled in to Reddit. I found this so intriguing because this is, in a way, a direct way to see my behaviour pattern for Reddit usage. Techinacally, I am a Reddit user since the early 2020 but I have started using it regulary since the end of 2022 and the beginning of 2023. So, the data I have is mostly from my activity in 2023 and I have also did some additional filtering which I will elaborate on later. I think the data is also interesting in this way because mostly being from 2023 means that it might mean that it can hold some light to my current behaviour.
In order to do some exploration on the data I done some processing on the data -convert to local time, extract day of week, and month etc.- I have created some plots to see if there is any pattern that can be seen easily.
One of the first plots that I have created was the following one. It shows the number of logins in thirty minutes intervals.
The figure clearly shows that I am most active in the afternoon and evening with some activity in the morning and night while almost no activity in the early times of the day. However, this is not interesting because it is expected that one would be sleeping between 12 am and 8 am while being more active in the afternoon and evening. So, I needed to dig deeper. After testing with different configurations such as different time intervals, looking to yearly and monthly activity, I have decided to look at the daily activity.
Looking at the daily activity, I have seen that there are distinct peaks in each day. One of my immediate guesses that these peaks are the times are my class times. Because my thought was that during classes I would be more prune to get distracted and bored, so I would be checking Reddit, which is the only social media platform that use on regular bases, while in my free time probably I would be doing something that I engage with more actively. So, I have plotted each day along with rulers showing my class times (mid point of the class). Then I have formed my hypothesis and tested it more formally instead of just guessing with visuals.
You can use the checkboxes to show/hide the rulers.
Hypothesis Testing
If we need to put in a general way, my hypothesis is that I am more likely to login to Reddit during my class times. To test this idea, I have formed the following hypotheses.
Null Hypothesis: I am equally active during my classes and free times.
Alternative Hypothesis: I am more active during my classes and less active during my free times.
I have groupped each interval as a class time or a free time then in order to test the hypothesis, I have decided to use t-test because I will compare the means of two groups to see if there is a significant difference. The two groups are my class time intervals and my free time intervals. I have compared the results against a significance level of 0.05.
Note that I have applied the test for week days only and to the data starting from October 2023. Because I want to test it against my current academic term (Fall 2023-2024).
Results
-
Monday: Reject the null hypothesis. (p-value: 0.015)
The test results shows that the mean of activity during class times is higher than during free times which is consistant with my idea. The activity peaked at time interval 16:30-17:00 which is during my “Advanced Programming” class. -
Tuesday: Reject the null hypothesis. (p-value: 0.042)
Again, the test shows that the mean of activity during class times is higher than during free times. The peaked was at 11:30-12:00 which is the time of my “Macroeconomics” class. -
Wednesday: Fail to reject the null hypothesis. (p-value: 0.14)
The test failed to reject the null hypothesis. However, the mean of activity during class times is still higher than during free times. And the activity peaked at time interval 12:30-13:00 which is again during my “Advanced Programming” class.
A possible explanation for this is that I have only three hours of class in wednesdays which is the lowest of the week, along with thursday. So, I have more free time in Wednesdays than other days which can nudge the values towards a higher p-value. -
Thursday: Fail to reject the null hypothesis. (p-value: 0.12)
The test also failed to reject the null hypothesis for thursday. However, just like wednesday, the mean of activity during class times is still higher than during free times. And the activity peaked at time interval 11:30-12:00 which is still during my class time, “Discrete Mathematics”.
Just as I stated in wednesday, I also have only three hours of class in thursdays and they are relatively early in the day. Wednesday’s three hours are a bit distributed to the day, but thurday’s are from 10:40 to 13:30. -
Friday: Reject the null hypothesis. (p-value: 0.0002)
From the test I got similar results with the first two days. The mean of activity during class times is higher than during free times. At friday the peak was at 15:00-15:30, during my “Macroeconomics Recitation”.
Compared to other days friday has the highest significant difference with the lowest p-value. This could be caused by the fact that friday is my busiest day in terms of class hours. I have seven hours of class from 10:40 to 17:30. Therefore, I have less free time in fridays than other days, causing a higher difference between the means.
Weekends
Since there are no classes in weekends the previous hypothesis is meaningless, so I did not include weekends in the analysis. However, I still wanted to see if there is any pattern in the weekends and the plots still showed some peaks. So, I have decided to do some more analysis on the weekends.
My guess is that as seen from the aggregate plot, I am more active in the afternoon and evening, so without class hours weekends should also show an activity peak in the afternoon and evening. So I have hypothesized that the activity distributions must be close to a normal distribution with a peak in the afternoon.
To test this hypothesis, I have used a distribution fitting test from distfit library. I have tested against some simple distributions such as normal, uniform, and beta. Getting the following results in the graph below. (Note that the x-axis shows the time in minutes)
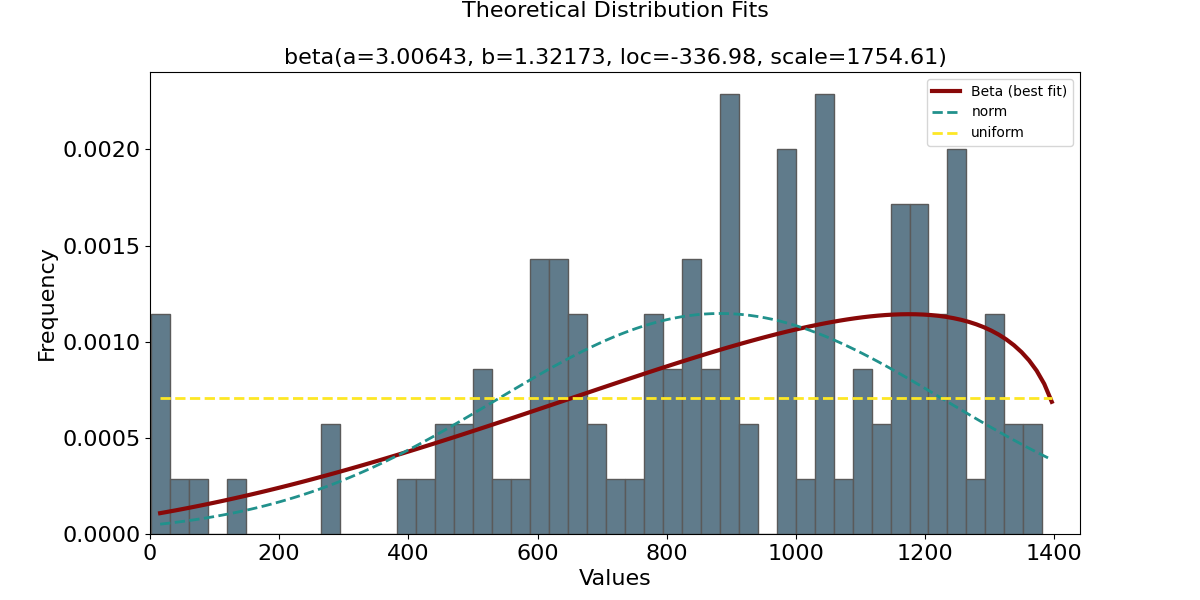
I have isolated these three theorethical distributions because they are the ones that I want to compare in a general sense, even though there were other fits between normal and uniform for example. However, beta distribution is the one that fits the best which means that the activity is a right scewed distribution with a peak around 16:00-17:00. Therefore, my hypothesis seems to be correct in a way that the activity is a skewed kind of non-uniform distrubiton and I am more likely to be active in the afternoon and evening for weekends.